📌 Key Takeaways
A kraft paper lab report isn’t paper science—it’s a procurement decision tool that determines whether a shipment moves forward, triggers corrective action, or gets rejected.
- Method Alignment Comes First: Before judging any numeric result, confirm the test method (ISO versus TAPPI) matches your RFQ specification—cross-method comparisons mislead without proper validation.
- Check Moisture Before Everything Else: When multiple properties appear marginal, verify moisture content first because elevated moisture creates a cascade effect that depresses tensile strength and alters Cobb values.
- Systematic Deviation Signals Calibration Issues: Consistent overweight or underweight basis weight across a lot points to mill calibration problems, while random variation indicates process instability requiring different corrective actions.
- Three Consecutive Failures Trigger an Audit: Reserve full supplier audits for patterns—when the same property fails across three consecutive lots, recurring inconsistencies emerge, or critical failures occur.
- One-Page CAPA Keeps Suppliers Accountable: Structure corrective action requests with four components—problem statement, root cause hypothesis, corrective action, and verification plan—to maintain quality standards without adversarial language.
Master these five principles and you transform reactive shipment checks into a disciplined procurement workflow that catches problems before they reach your converting lines.
Procurement and quality assurance managers at packaging manufacturers will find this framework essential, preparing them for the detailed step-by-step interpretation process that follows.
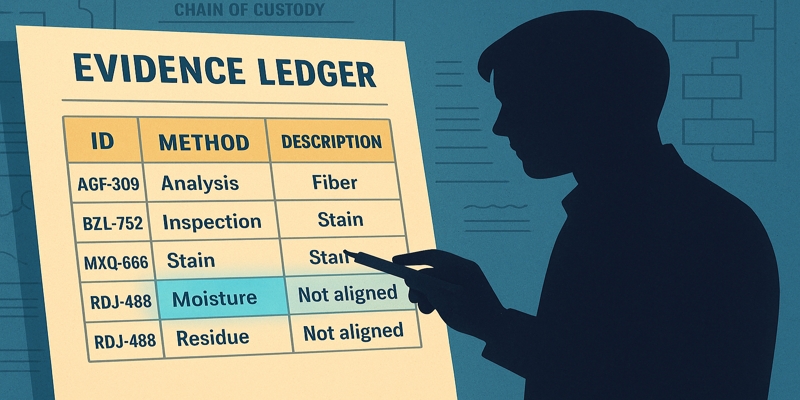
A shipment arrives. The supplier sends the mill certificate. Twenty data points stare back at you—basis weight, tensile, Cobb, Mullen—but what matters right now is a single question: does this paper meet your spec, or do you halt the line?
For procurement and quality assurance managers at packaging manufacturers, the kraft paper lab report is more than a formality. It’s a decision tool that determines whether a shipment moves forward, gets flagged for corrective action, or gets rejected outright. Yet many teams treat it as arcane paper science rather than what it truly is: a recurring health check for your supply chain.
This guide walks through the report methodically—not as a chemistry lesson, but as a procurement workflow. You’ll learn which numbers to verify first, how to interpret variances against your original RFQ specifications, and when to escalate a finding to a full supplier audit through a structured kraft paper supplier audit & compliance program.
What a Kraft Paper Lab Report Contains (and Why It Matters to Procurement)
Typical Sections You’ll See

Most kraft paper lab reports follow a standard structure governed by international testing standards. The paper and board testing methods are cataloged under ICS 85.060, the ISO classification system that organizes standards like ISO 536 (basis weight), ISO 535 (Cobb), ISO 187 (conditioning atmosphere), and ISO 287 (moisture content).
At the top, you’ll find sample identification details: batch number, production date, grade designation (virgin or recycled, bleached or unbleached). Below that comes the methodology section, where the testing lab lists which standards it followed—TAPPI T 410 for basis weight, ISO 535 for water absorbency, and so forth.
The results table is the heart of the document. Each row corresponds to a physical property: grams per square meter (GSM), moisture percentage, tensile strength, tear resistance, burst strength, and Cobb value. The final column often includes remarks or notes—phrases like “conditioned at 23°C, 50% RH” or “retest recommended.”
How Results Map to Spec Sheets and Acceptance Criteria
Your RFQ specification sheet sets the baseline. If you requested 120 GSM ±3%, the lab report must confirm the actual basis weight falls within 116.4 to 123.6 GSM. The challenge is that not every property has a simple pass/fail threshold. Moisture content affects printability and handling; a small drift might be acceptable, but consistent upward creep signals process instability. Similarly, tear and burst values directly predict bag or wrap durability during converting operations.
The report’s role is to provide objective evidence that the mill can consistently hit your targets. When numbers land outside tolerance, the report becomes the starting point for a structured conversation with the supplier—one grounded in method alignment and shared terminology rather than subjective judgments about quality.
Step-by-Step: Reading the Numbers Like a Buyer
Confirm Identification and Method
Start by verifying that the sample ID on the report matches the batch or lot number from your purchase order. Next, scan the methodology column. Standards bodies like TAPPI and ISO publish harmonized test methods, but mills sometimes use regional variants. For instance, burst strength might be tested using TAPPI T 403 (Mullen tester) or ISO 2758. Both are valid, but they represent different method ecosystems—the numeric results aren’t directly interchangeable. If your spec cites one method and the report lists another, flag it immediately for clarification.
Match to Your RFQ Spec
Pull up your original RFQ specification sheet and place it side-by-side with the lab report. Every property you specified—basis weight, caliper, moisture, tensile, tear, burst, Cobb—should appear in the results table. Missing data points are a red flag. If you requested Cobb values for a moisture-barrier application and the report omits them, the supplier may not have tested for water absorbency at all.
Check Basis Weight (GSM) vs. Tolerance
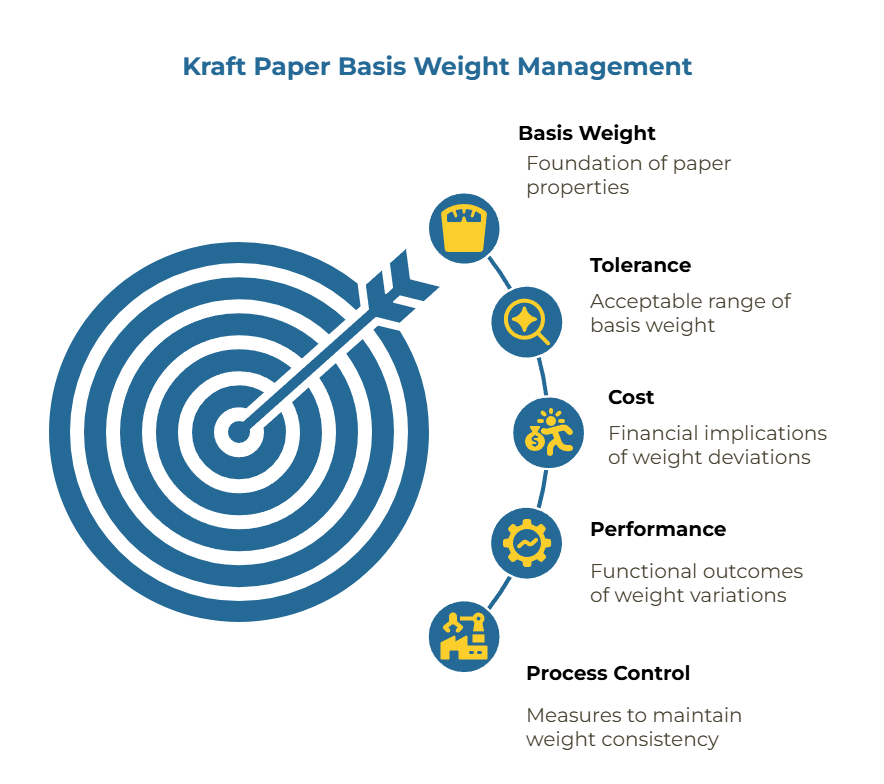
Basis weight is the foundation. It’s the grams of paper per square meter, typically measured per ISO 536 or TAPPI T 410, and it drives both yield and cost. A 120 GSM spec with ±3% tolerance allows 116.4 to 123.6 GSM. If the report shows 125 GSM, you’re paying for extra fiber you didn’t order, which inflates your per-ton cost. Conversely, if it shows 115 GSM, the paper may underperform in strength tests, leading to failures during converting or end-use.
When basis weight falls outside tolerance, determine whether the deviation is systematic or random. Systematic deviation—consistent overweight or underweight across the lot—often points to calibration issues at the mill. Random variation suggests process variability, which may require different corrective actions. Understanding why spec alignment beats quote-chasing prevents these silent cost drains.
Check Moisture Content
Moisture is typically tested using TAPPI T 412 or ISO 287. The acceptable range for kraft paper usually sits between 6% and 8%, though this varies by grade and end-use. High moisture (above 9%) creates handling problems: the paper becomes limp, harder to feed through converters, and prone to dimensional instability. Low moisture (below 5%) makes the paper brittle and increases the risk of cracking during folding or creasing operations.
Here’s a critical insight: when multiple properties appear marginal, check moisture first. Elevated moisture depresses tensile strength and alters Cobb values through a cascade effect. Correcting moisture often brings other properties back into range without additional intervention. Before making any final judgment on moisture-related discrepancies, verify that samples were conditioned according to ISO 187, the standard atmosphere specification (23°C, 50% relative humidity).
How to Read Kraft Paper Tensile Test Report
Tensile strength measures how much force the paper can withstand before breaking, reported in kilonewtons per meter (kN/m). Most labs use TAPPI T 494 or ISO 1924-2, which specifies a constant rate of elongation. The report will list both machine direction (MD) and cross direction (CD) values because paper behaves anisotropically—it’s stronger along the grain.
For procurement, tensile matters most when the kraft paper will be wound into rolls or subjected to web tension during printing or coating. A spec that calls for 8.0 kN/m MD should see lab results consistently within ±0.5 kN/m. Values below tolerance indicate weak fibers or insufficient refining during pulping, which can cause web breaks on high-speed converting lines.
If cross-direction tensile is low but machine-direction values meet spec, assess the machine-direction bias for your specific converting line and end-use application. Some applications tolerate greater anisotropy than others.
Check Tear (Elmendorf) and Burst (Mullen/ISO)
Tear resistance, measured using ISO 1974 or TAPPI T 414, predicts how easily the paper propagates a rip once started. For bags and wraps, high tear resistance prevents catastrophic failure when a small nick occurs during handling.
Burst strength, tested via TAPPI T 403 or ISO 2758, measures internal bonding. It simulates the pneumatic stress a paper bag experiences when filled with bulk materials. For sack kraft or heavy-duty packaging applications, evaluate tear and tensile trends alongside burst rather than relying on a single metric. How Cobb and burst affect real cost becomes evident during claims: a single burst failure on a customer’s packing line can trigger chargebacks that dwarf any savings from a lower-priced supplier.
Check Cobb (ISO 535) for Water Absorbency
The Cobb test measures water absorbency in grams per square meter over a fixed time period, typically 60 seconds. Confirm which side was exposed during testing—felt side versus wire side, or outside versus inside for coated or treated papers—as this affects interpretation for asymmetric grades.
For moisture-barrier applications—food-grade wraps, moisture-sensitive bulk goods—the Cobb value must stay low. A spec might call for Cobb ≤30 g/m². If the report shows 45 g/m², the paper will absorb too much water, compromising barrier performance and potentially causing contents to deteriorate during storage or transit.
Kraft Paper Moisture Content Acceptable Range

While the general industry guideline sits between 6% and 8%, the acceptable range depends heavily on your end-use and storage conditions. Papers destined for high-humidity climates might tolerate the upper end of that range, while papers for precision printing or coating operations need tighter control—often 6.5% to 7.5%. The critical question isn’t whether the report falls within a textbook range, but whether it aligns with the tolerance you negotiated in the RFQ.
If moisture drifts consistently toward the high end across multiple shipments, it signals process instability at the mill. That’s your cue to request a corrective and preventive action (CAPA) plan.
Resolve Discrepancies
Discrepancies fall into three categories: true non-conformities (results outside tolerance), method mismatches (your spec cites TAPPI T 410, the lab used ISO 536), and conditioning errors (sample tested at 20°C/65% RH instead of the standard atmosphere defined in ISO 187).
For true non-conformities, request a retest from a retained sample. If the retest confirms the outlier, the issue is real. For method mismatches, consult the standards to see if results are directly comparable. ISO 536 and TAPPI T 410 both measure basis weight gravimetrically and typically yield equivalent results, but you should verify with the mill’s QA team. Conditioning errors require retesting under standardized conditions per ISO 187 before making any acceptance decision.
Decide: Accept, Conditional Accept (with CAPA), or Reject
The final step is binary: does this shipment meet your requirements? If all properties land within tolerance and methods align, you accept. If one or two properties fall slightly outside tolerance but the variance won’t compromise end-use performance, you might conditionally accept while requesting a CAPA from the supplier to prevent recurrence.
Rejection is reserved for significant non-conformities—basis weight off by more than 5%, moisture above 10%, burst strength below minimum functional requirements. A rejected shipment triggers a formal supplier review and, depending on severity, an escalation to a full factory audit.
Turning Findings Into Procurement Actions (with Supplier-Friendly Language)
Referencing Methods Without Price Claims
When discussing results with suppliers, frame your feedback around test methods rather than subjective quality judgments. Instead of saying “this paper feels weak,” reference the data: “The tensile values in the lab report show 7.2 kN/m MD against our spec of 8.0 kN/m per TAPPI T 494. Can your QA team confirm the refining process is within normal parameters?”
This approach keeps the conversation technical and objective. Use neutral phrasing like “Results were generated per ISO 2758; our RFQ requests TAPPI T 403 equivalence. Let’s align the method for future lots.” The supplier can investigate process variables—refining consistency, fiber source, chemical additives—without feeling accused of delivering substandard products. It also protects you from making pricing-related claims.
Writing a Short CAPA Request for Spec Drift
A corrective and preventive action request documents the non-conformity and asks the supplier to identify root cause and implement controls. Keep the CAPA to one page with four essential components:
- Problem Statement: Identify the property, the actual value versus specification, and the test method used.
- Root Cause Hypothesis: Propose likely causes such as reel moisture drift, caliper control issues, or conditioning variance.
- Corrective Action: Specify the process adjustment needed—set-point changes, maintenance schedules, or operator verification protocols.
- Verification Plan: Define the next-lot test plan, including which method will be used and the pass criteria.
A concise example might read: “Ref: PO #12345, Batch #6789. Lab report dated 2025 shows moisture content at 9.2% (spec: 6.0–8.0%, per TAPPI T 412). Root cause appears to be insufficient drying time during production. Corrective action: Adjust dryer residence time by 15% and verify moisture on next three production runs. Verification: Test per ISO 187 conditioning, target 7.0% ±0.5%.”
This language is clear, non-adversarial, and action-oriented. It gives the supplier a clear path to resolution while maintaining your quality standards.
When to Escalate to an Audit in the Compliance Program

Not every variance warrants a full audit. Reserve audits for patterns: if the same property fails across three consecutive lots, or if recurring basis weight inconsistencies emerge, or if a single critical failure occurs (burst strength 30% below minimum). Persistent issues with method alignment or unclear conditioning practices also justify escalation.
A structured audit program—covering process capability, ISO alignment, and certificate verification—provides the deep dive needed to assess whether the supplier can reliably meet your requirements over time.
Mini-Checklist You Can Print or Share
Use this as your quick-reference guide when a new lab report arrives:
- Sample ID matches PO/batch number: Confirm traceability
- Test methods align with RFQ spec: TAPPI/ISO consistency verified
- Basis weight within tolerance (±%): Check for systematic vs random deviation
- Moisture content 6–8% (or per spec): Verify ISO 187 conditioning noted
- Tensile strength (MD/CD) meets minimum: Review jaw speed and strip dimensions
- Tear resistance (Elmendorf) within range: Method-correct comparison confirmed
- Burst strength (Mullen/ISO) meets minimum: Avoid cross-method comparison
- Cobb value ≤30 g/m² (if applicable): Confirm test interval and side specification
- Conditioning atmosphere noted (23°C, 50% RH per ISO 187): Standard test environment
- Remarks section reviewed: Retest flags, deviations, anomalies
- Decision logged: Accept / Conditional Accept (CAPA) / Reject
- Next action assigned: PO release, supplier follow-up, or audit trigger
- Results filed for trend analysis: Track supplier consistency over time
- QA team notified of variances: Cross-functional alignment maintained
- Documentation archived: Compliance and audit trail preserved
Download this checklist as a one-page PDF and share it with your procurement and QA teams for consistent evaluation across all incoming shipments.
Frequently Asked Questions
What If the Lab Used ISO 2758 but the Mill Cites TAPPI T 403?
Both ISO 2758 and TAPPI T 403 measure burst strength, but they represent different method ecosystems with distinct test conditions, equipment calibration standards, and result reporting conventions. The numeric results are close but not identical. If your spec explicitly calls for TAPPI T 403 and the report shows ISO 2758, request a method-aligned retest or ask the mill to provide documented conversion factors validated by their QA team. For future orders, align on a single standard during the RFQ phase to avoid confusion. Keep procurement judgments method-consistent rather than attempting cross-method comparisons without proper validation.
How Much Moisture Drift Is Acceptable Before I Escalate?
A single shipment with moisture at 8.5% (against a spec of 6.0–8.0%) might not warrant immediate escalation, especially if it’s a first occurrence and you can confirm the paper still performs adequately in your process. However, if three consecutive shipments show moisture creeping from 7.0% to 7.5% to 8.2%, that trend signals process instability.
Before escalating, investigate the conditioning protocol. Verify that samples were tested per ISO 187 standard atmosphere and that the method (TAPPI T 412 or ISO 287) matches your RFQ. Moisture swings can cascade into tensile, tear, and Cobb shifts, so addressing this first often resolves multiple marginal properties simultaneously. If drift persists across lots despite proper conditioning and method alignment, request a CAPA and consider a supplier review.
Can I Compare Burst Values Across Different Test Methods?
Avoid direct comparisons across methods (ISO 2758 versus TAPPI T 403) without an agreed conversion factor and QA validation. While both measure resistance to rupture under hydraulic pressure, differences in clamping mechanisms, test speed, and calibration standards mean the absolute values differ. If you’re comparing two suppliers and one reports results in TAPPI T 403 while the other uses ISO 2758, ask both to retest using the same method, or have your quality team confirm an accepted equivalence formula. Treat mixed-method comparisons as indicative only, not decision-grade data. The safest approach is to standardize on one method in your RFQ specifications.
Who Pays for Re-Testing?
This is context-dependent and should be addressed in your purchase agreement’s quality clause. Common practice: the supplier bears the cost when their method deviates from the RFQ specification or when initial testing reveals a clear non-conformity (results outside agreed tolerance). If the discrepancy arises from a method mismatch not specified in the original RFQ, or if you request additional testing beyond the original scope for your own verification purposes, the cost allocation becomes negotiable. Clarify this expectation upfront in your RFQ to avoid disputes when re-testing is needed.
Make the Report Your Negotiation-Neutral Compass

The kraft paper lab report you opened at the start of this guide is no longer a wall of inscrutable data. It’s a structured map that guides you from raw numbers to confident procurement decisions. You’ve learned to verify sample traceability, confirm method alignment using the proper ISO and TAPPI standards, interpret each property’s impact on cost and performance, and translate findings into actionable supplier communication—all without subjective quality claims or pricing judgments.
This disciplined approach transforms one-off shipment checks into a repeatable workflow. As your team builds fluency in reading these reports, you’ll spot patterns earlier—whether it’s systematic basis weight drift pointing to calibration issues or moisture creep signaling process instability. You’ll engage suppliers with precision, referencing specific methods and tolerance windows rather than vague quality concerns. And you’ll reduce the risk of costly downstream failures by catching problems before they reach your converting lines.
The next step is to integrate this report-reading discipline into a broader supplier verification framework, one that includes periodic audits triggered by the three-consecutive-lots threshold, process capability reviews, and long-term performance tracking through your compliance program.
Teams that master report interpretation today position themselves to build a resilient, data-driven audit and compliance program tomorrow. Fewer surprise failures. Clearer supplier accountability. Stronger supply chain confidence. That’s the compounding return on a skill that starts with a single document and grows into strategic advantage.
Explore more spec-interpretation guides in the PaperIndex Academy.
Resources
- Why spec alignment beats quote-chasing — Comparability Before Price
- When Cobb/burst drive real cost — Quality Specs vs Price
- When to escalate to an audit — Factory Audit: Decision Checklist
External Standards References:
- ISO Catalogue for Paper & Board Testing Methods — ICS 85.060 classification including ISO 535, 536, 187, 287, 1924, 1974, 2758
- ISO 2758: Bursting Strength of Paper
- ISO 1974: Elmendorf Tearing Resistance
- ISO 187: Standard Atmosphere for Conditioning
Disclaimer: This guide is for educational purposes. Lab report interpretation should be adapted to your specific requirements, industry standards, and supplier agreements. For mission-critical decisions, consult with your internal QA team and industry experts.
Our Editorial Process
Our expert team uses AI tools to help organize and structure our initial drafts. Every piece is then extensively rewritten, fact-checked, and enriched with first-hand insights and experiences by expert humans on our Insights Team to ensure accuracy and clarity.
About the PaperIndex Insights Team
The PaperIndex Insights Team is our dedicated engine for synthesizing complex topics into clear, helpful guides. While our content is thoroughly reviewed for clarity and accuracy, it is for informational purposes and should not replace professional advice.